If you want your research to influence conversations, credibility and clarity are non-negotiable. Journalists need data they can trust and insights they can explain to their audiences.
This article walks through how to design surveys that media outlets will actually cite, and six mistakes that can undermine even the strongest research.
Build Surveys on a Strong Foundation
A survey starts long before the first question is asked. It begins with clarity about what you want to achieve and why it matters. That means:
Define your research objective
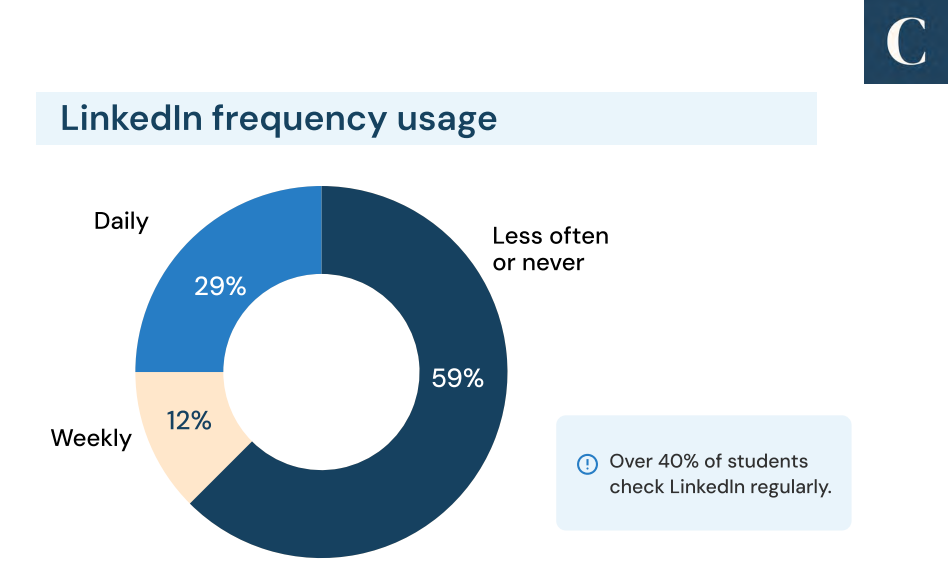
Ask yourself: what single question are we trying to answer? For example, instead of running a broad survey on “education in Nigeria,” narrow the focus to “how Nigerian students are using LinkedIn to find jobs.” That sharper lens makes the findings easier for journalists to frame into a story.
Know your audiences
You have two to keep in mind:
- Respondents. They should be people whose experiences or opinions matter for the issue at hand. If you’re studying financial technology, your respondents should include active users of digital banking services, not just the general public.
- Media. Think about what reporters covering business, education, or social issues might find useful. A survey on how small businesses are handling rising costs, for instance, could be valuable for economic reporting.
Choose a timely, relevant topic
Media outlets are more likely to cite your work if it connects to current debates or fresh developments. A survey on remote work published in 2019 might have been sidelined, but the same survey in 2020 was headline material. Timing matters as much as the questions you ask.
By laying this groundwork, you set up your survey not just as a research exercise but as a credible contribution to public conversation.
Design a Credible Methodology
A strong idea can fall apart if the methodology is weak. Journalists and editors often scan the methodology first to decide whether a survey is worth citing. If the process looks sloppy, the findings may not be trusted.
Get the sample size right.
Bigger isn’t always better, but too small is a red flag. For example, a national survey with only 70 respondents may struggle to be taken seriously. Aim for at least several hundred respondents for general population surveys, and more when you want to break results down by demographics like gender or region.
Make the sample representative.
A survey on youth employment that only includes university students leaves out millions of young people. Media outlets look for balance across geography, income levels, gender, and other key markers. Even if your scope is narrow — say, fintech users in Lagos — state that clearly so the limits are understood.
Write clear, unbiased questions.
Leading questions produce weak data. For example:
- Biased: “How much do you agree that digital banks are safer than traditional banks?”
- Neutral: “How safe do you consider digital banks compared to traditional banks?”
The second allows respondents to share a range of views instead of being nudged toward a positive answer.
Keep the survey concise.
Long surveys tire respondents, and rushed answers weaken results. Aim for 8-12 well-designed questions. If you need to explore more, consider multiple shorter surveys instead of one bloated questionnaire.
When your methodology is solid, you give media outlets confidence that the results can stand up to public scrutiny. That confidence is what makes them more likely to cite your work.
Translate Findings Into a Story
Good data doesn’t speak for itself. To be picked up by the media, your findings need to be presented in a way that tells a story. Numbers are the foundation, but interpretation makes them newsworthy.
Highlight the main takeaways. Journalists are drawn to results that are surprising, clear, or confirm a growing trend. Instead of burying your key finding in a long table, pull it out. For example: “Seven out of ten young Nigerians say LinkedIn is their most useful tool for finding internships.”
Compare and contrast. Raw numbers are harder to interpret than comparisons. Show change over time (“a 20% increase from 2023”), differences across groups (“urban vs. rural responses”), or international contrasts (“Nigerian students are twice as likely as UK students to use LinkedIn for jobs”). These angles give reporters ready-made headlines.
Use plain language. Replace technical terms with wording that a general reader can understand. For instance, don’t say “respondents demonstrated a statistically significant preference.” Say “most people preferred.”
Visualize the results. Simple charts or infographics make it easy for outlets to use your data. A pie chart showing that 65% of small business owners prefer mobile payments can travel further online than a block of text describing the same thing.
Write a press-ready summary. Create a one-page summary sheet that includes the top findings, key comparisons, and a short explanation of the methodology. Think of it as the version a journalist could copy directly into a news article.
Package and Share Strategically
Even the best research can be overlooked if it isn’t shared the right way. Media outlets are busy and need information that’s easy to access, verify, and use. The way you package your survey results can make the difference between silence and citations. Here are some things to consider:
- Craft accurate, engaging headlines. Your headline should highlight the most newsworthy finding without exaggeration. For example:
- Strong: “One in three UK workers want a four-day week”
- Weak: “Survey results about work preferences.” The first headline gives a clear, memorable takeaway.
- Prepare a press release. A concise release that explains the main findings, why they matter, and how the data was collected gives journalists everything they need in one place.
- Publish the full report. Hosting your report on your website builds credibility and makes it easy for others to reference the original source. Add downloadable assets like the full dataset, charts, or a summary PDF.
- Share visuals and highlights. Provide ready-to-use graphics, charts, or even short social media snippets. This increases the chance your data will be reposted or embedded.
- Pitch to the right journalists. Don’t just send your survey to a general inbox. Identify reporters who cover the specific issue — finance, education, technology, or culture — and send them tailored notes showing why your findings matter for their beat. It helps to build a targeted media map beforehand.
6 Mistakes That Kill Credibility
Here’s a closer look into mistakes that could make journalists hesitate to cite your work or also harm your organization’s reputation if not watched out for:
- Using a tiny or skewed sample. A survey of 50 people isn’t enough to claim national insights. Similarly, if your sample only covers one city but you frame it as “countrywide,” journalists will quickly spot the flaw.
- Asking vague or leading questions. Questions like “Do you support better healthcare?” don’t produce meaningful insights. They’re too broad. And leading wording, such as “How much do you agree that online banking is safer?” pushes respondents in one direction, weakening the credibility of results.
- Relying on jargon or technical phrasing. A finding that says “respondents showed a 0.65 correlation coefficient” won’t land with most audiences. Clear language — “most respondents said they prefer X over Y” — travels further.
- Highlighting only what supports your viewpoint. Cherry-picking data erodes trust. If your survey revealed both positive and negative results, include both. Transparency makes your work more credible and more likely to be cited.
- Skipping the methodology section. Media outlets want to know how you arrived at your results. Without a brief explanation of sample size, demographics, and question design, they may consider your survey untrustworthy.
- Overselling minor findings. Claiming “groundbreaking” insights from small or unsurprising results risks backfiring. Journalists prefer a modest, accurate framing to exaggerated claims.
Avoiding these pitfalls strengthens the integrity of your survey and makes it a reliable source that media outlets are willing to reference.
A Survey Only Matters When It’s Heard
When you frame your questions carefully, choose the right respondents, and share the results in a way journalists can trust, your research doesn’t just collect numbers. It becomes part of the story shaping public debate.
At Column, we guide that process end to end. We help design the methodology, frame the right questions, analyze the results, and package the findings into reports and visuals that journalists can confidently use.
If you’re planning a survey and want it to do more than collect numbers, let’s talk.

Johnson is a Content Strategist at Column. He helps brands craft content that drives visibility and results. He studied Economics at the University of Ibadan and brings over years of experience in direct response marketing, combining strategy, creativity, and data-backed thinking.
Connect with him on LinkedIn.